
Key Takeaways
- Shifting long-haul freight from over-the-road trucking to intermodal rail reduces greenhouse gas emissions by up to 75% while simultaneously cutting transportation costs by 30-50%.
- Accurate upstream transportation emissions reporting requires calculating total tonne-kilometres using verified emission factors from the Railway Association of Canada.
- Scope 3 Category 4 compliance demands traceable, structured bill-of-lading data that holds up during third-party ESG audits.
- Maximizing container payload directly improves your intermodal freight carbon footprint by reducing the total number of shipments required annually.

Achieving meaningful rail freight emissions reduction requires supply chain executives to rethink how they move long-haul cargo across Canada. For most business-to-business (B2B) shippers, upstream transportation and distribution represent the largest uncontrolled segment of their corporate carbon footprint. As regulatory pressure mounts and enterprise clients demand stricter environmental, social, and governance (ESG) compliance, relying exclusively on over-the-road trucking is no longer sustainable.
Shifting 40-foot and 53-foot container traffic to the Canadian National (CN) and Canadian Pacific Kansas City (CPKC) rail networks provides a highly auditable data trail for compliance while cutting greenhouse gas (GHG) emissions by up to 75%. Beyond the environmental benefits, this strategic shift acts as a high-capacity hedge against highway volatility, consistently delivering 30-50% cost savings compared to long-haul trucking.
Navigating the complex landscape of carbon accounting requires precise methodologies and verified data. Logistics analysts must move beyond rough estimates and implement rigorous tracking for every lane. This guide breaks down the exact steps required to measure, document, and report your logistics emissions, providing a clear roadmap for transitioning your supply chain to a more sustainable, cost-effective intermodal model.
1. The Baseline: Understanding Scope 3 Category 4 Emissions
Scope 3 category 4 emissions encompass all indirect greenhouse gases produced by upstream transportation and distribution activities, requiring precise tonne-kilometre tracking for regulatory compliance. According to the Greenhouse Gas (GHG) Protocol Corporate Value Chain Standard, these emissions occur from sources not owned or controlled by the reporting company, specifically focusing on the transportation of products purchased or acquired by the reporting company in the reporting year.
For Canadian shippers, this category includes inbound logistics, outbound logistics paid for by the shipper, and transportation between a company’s own facilities using third-party carriers. Because the shipper does not own the trucks or trains, gathering accurate data has historically been a challenge. Over-the-road trucking relies on thousands of fragmented carriers, each with different fuel efficiency standards and reporting capabilities. This fragmentation makes accurate scope 3 emissions freight tracking incredibly difficult, often forcing sustainability managers to rely on industry averages rather than primary data.
Under the GHG Protocol, companies are encouraged to transition from these ‘spend-based’ or ‘distance-based’ secondary estimation methods to ‘fuel-based’ or ‘activity-based’ primary data methods. This transition is critical because spend-based calculations often overestimate emissions by 20-40%, penalizing companies that are actively working to optimize their logistics networks.
Intermodal rail shipping fundamentally changes this dynamic. By consolidating long-haul freight onto the CN and CPKC networks, shippers gain access to standardized, highly regulated fuel consumption data. This consolidation simplifies the reporting process, allowing companies to establish a precise baseline for their scope 3 category 4 emissions and set realistic, achievable reduction targets.
Furthermore, the regulatory landscape in Canada is shifting rapidly, making this baseline establishment more urgent than ever. Under the Canadian Net-Zero Emissions Accountability Act, the federal government has committed to achieving net-zero emissions by 2050, with interim targets for 2030. As part of this commitment, large enterprises are increasingly required to disclose their climate-related financial risks and greenhouse gas emissions across all three scopes. This means that Canadian shippers can no longer treat Scope 3 reporting as a voluntary PR exercise.
Enterprise customers are actively auditing their supply chains, and suppliers who cannot provide transparent, verified emissions data risk losing major contracts. Transitioning to intermodal rail not only reduces the physical volume of emissions but also provides the structured, auditable data trail required to satisfy these stringent corporate and regulatory procurement mandates.
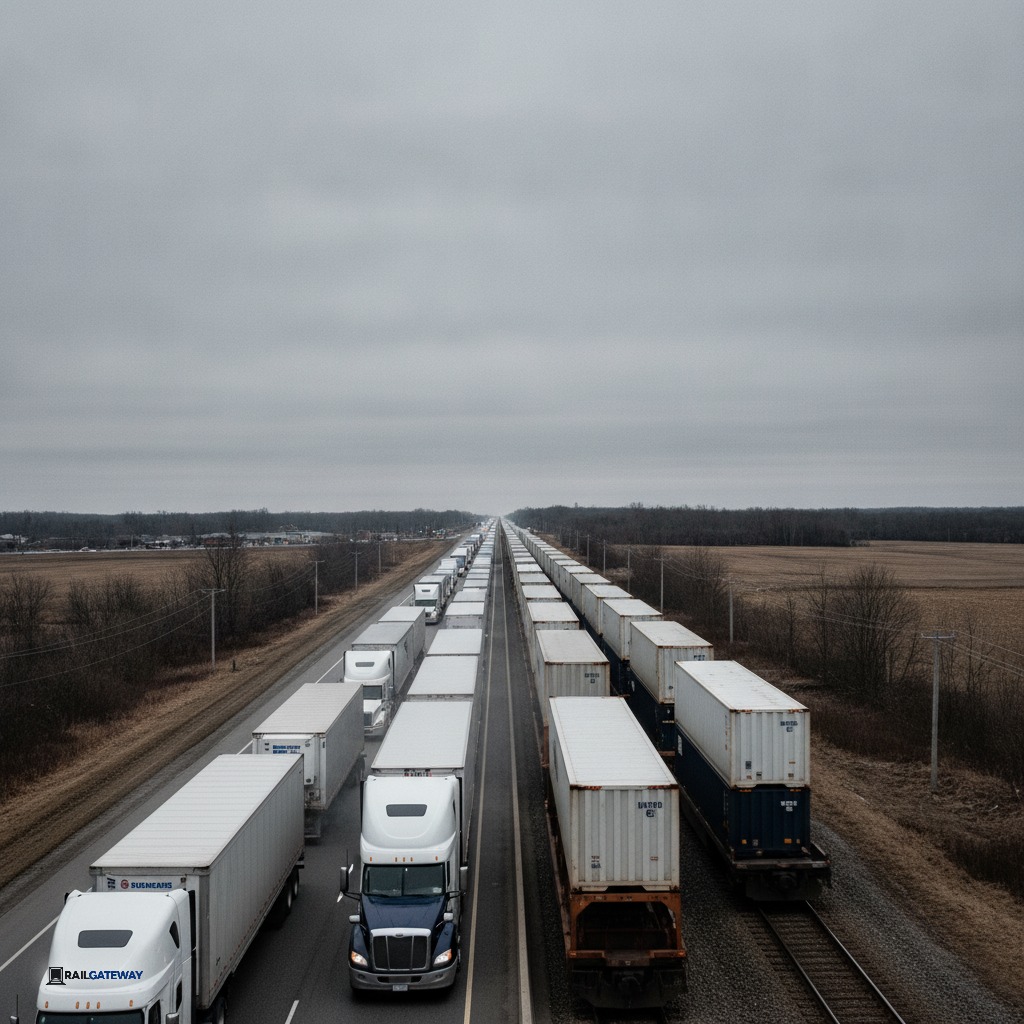
2. Truck vs Rail at a Glance: The Emissions and Cost Comparison
Intermodal rail cuts greenhouse gas emissions by up to 75% and reduces long-haul freight costs by 30-50% compared to over-the-road trucking. This dual advantage makes rail the most effective lever for supply chain optimization in Canada. When evaluating intermodal rail emissions against highway transport, the physics of steel wheels on steel rails provide an undeniable efficiency advantage.
Freight Mode Comparison Snapshot
| Metric | Over-the-Road Trucking | Intermodal Rail (CN / CPKC) |
|---|---|---|
| Cost Profile | Highly volatile, subject to fuel spikes | 30-50% savings on long-haul lanes |
| Emissions Output | High (accounts for majority of transport GHG) | Up to 75% lower greenhouse gas emissions |
| Data Traceability | Fragmented across thousands of carriers | Centralized, highly auditable network data |
| Capacity per Unit | Single trailer per driver | Up to 300 containers per train |
Transport Canada data highlights the scale of the problem. On-road freight accounted for 36.51 megatonnes (Mt) of emissions in 2021, representing a massive portion of domestic transport emissions. Every long-haul highway shipment contributes heavily to this national total. By utilizing a truck vs rail emissions calculator, logistics teams can model the exact impact of shifting specific lanes. The results consistently show that moving freight off the highway and onto the rail network is the fastest path to achieving corporate sustainability goals without sacrificing operational efficiency.
Understanding Intermodal Transit Times
While intermodal rail offers substantial cost and emissions benefits, logistics managers must plan for slightly longer transit times compared to direct over-the-road trucking. Typically, intermodal rail adds 1 to 2 days to the transit schedule on major Canadian corridors (such as Toronto to Vancouver) due to terminal handling, container mounting, and first- and last-mile drayage. However, because rail schedules are highly consistent and bypass highway congestion, weather delays, and driver hours-of-service limitations, they offer highly predictable arrival windows that allow supply chain planners to easily adjust their inventory buffers.
3. How to Execute a Freight Carbon Footprint Calculation
A precise freight carbon footprint calculation multiplies total cargo weight by distance traveled and the mode-specific emission factor to yield total carbon dioxide equivalent. This mathematical formula is the bedrock of all logistics carbon accounting. To begin, shippers must calculate the tonne-kilometre (tkm) for every shipment. One tonne-kilometre represents one metric tonne of freight transported across one kilometre.
To execute this calculation, gather the exact payload weight of your 40-foot or 53-foot container from the bill of lading. Convert this weight to metric tonnes. Next, determine the exact rail route distance between the origin ramp and the destination ramp, adding the highway distance for the first-mile and last-mile drayage. Multiply the weight by the total distance to find your tkm.
Finally, multiply the tkm by the specific emission factor for the transport mode. Because an intermodal move involves both rail and truck components, you must calculate the intermodal freight carbon footprint by applying the rail emission factor to the rail segment and the heavy-duty truck emission factor to the drayage segments. Summing these figures provides the total greenhouse gas emissions for that specific container move. This granular approach ensures your data holds up under intense scrutiny.
For example, if you ship a 20-tonne payload over a 3,000-kilometre rail corridor with 100 kilometres of total drayage, you would calculate 60,000 tkm for the rail portion and 2,000 tkm for the road portion. Applying the respective mode-specific factors to these distinct segments yields a highly accurate, auditable carbon footprint that reflects the true operational reality of your supply chain.
To achieve the highest level of accuracy, logistics analysts must also distinguish between Tank-to-Wheel (TTW) and Well-to-Wheel (WTW) emissions. TTW emissions, also known as direct tailpipe emissions, measure only the fuel consumed during the physical transport of the goods. WTW emissions, on the other hand, include the upstream emissions associated with extracting, refining, and distributing the fuel itself. While most corporate reporting frameworks focus primarily on TTW emissions for simplicity, leading Environmental, Social, and Governance (ESG) standards like the Global Logistics Emissions Council (GLEC) Framework strongly recommend reporting WTW emissions to capture the full environmental impact.
Additionally, shippers must establish clear protocols for handling empty backhauls and container repositioning. If a container must be returned empty to a rail ramp after delivery, the emissions generated during that empty leg must be allocated proportionally to the shipments that utilized that container, ensuring that no carbon goes unaccounted for in your final reporting.
4. Sourcing Verified Railway Association of Canada Emission Factors
Auditors require verified data, making Railway Association of Canada emission factors the gold standard for calculating domestic intermodal rail carbon footprints. Generic global averages or estimates provided by the Environmental Protection Agency (EPA) do not accurately reflect the specific operational efficiencies of the Canadian rail network. To ensure compliance, sustainability managers must use localized, highly specific data.
The Railway Association of Canada (RAC) publishes comprehensive data on the environmental performance of Canadian Railways. Their Locomotive Emissions Monitoring Report tracks the fuel consumption and greenhouse gas output of Class 1 Freight Railways like CN and CPKC. By utilizing these specific railway association of canada emission factors, shippers can confidently report their rail freight emissions reduction to stakeholders and regulatory bodies. These reports are published in partnership with Environment and Climate Change Canada, ensuring that the methodology is fully aligned with national inventory reporting standards. This alignment is crucial for enterprises that must report to international frameworks like the Carbon Disclosure Project (CDP) or the Science Based Targets initiative (SBTi), where third-party verification is mandatory.
These verified factors account for the unique geography of Canada, the specific locomotive technologies deployed by CN and CPKC, and the heavy payload capacities of Canadian intermodal trains. When comparing these figures against greenhouse gas emissions transport canada data for heavy-duty trucks, the environmental argument for rail becomes mathematically indisputable. Using the correct, localized emission factors is non-negotiable for companies seeking to publish credible ESG reports.
The remarkable efficiency of Canadian Class 1 Railways is driven by continuous technological innovation and operational optimization. Both CN and CPKC have invested heavily in modernizing their fleets with Tier 4 locomotives, which significantly reduce nitrogen oxides and particulate matter emissions compared to older models. Furthermore, these Railways utilize advanced software systems like Trip Optimizer, an autopilot-like system for trains that calculates the most fuel-efficient speed profile based on topography, train length, and weight. By automatically controlling throttle and dynamic braking, this technology reduces fuel consumption by up to 10%.
Distributed power, the practice of placing locomotives at the front, middle, and end of a train, also improves braking performance and train handling, allowing for longer, heavier, and more fuel-efficient trains. The Railway Association of Canada updates its emission factors annually to reflect these ongoing technological advancements, ensuring that shippers who use these factors are credited with the real-world efficiency gains achieved on the tracks.

5. Structuring Your Upstream Transportation Emissions Reporting
Effective upstream transportation emissions reporting requires standardizing carrier data, aligning with the GHG Protocol, and establishing clear baselines for year-over-year reduction. Without a structured reporting framework, the raw data generated by your freight carbon footprint calculation remains unactionable. Shippers must build a system that automatically captures, categorizes, and calculates emissions for every container moved.
Begin by integrating emissions tracking into your standard freight procurement process. Require all logistics partners to provide detailed routing and weight data for every shipment. For the drayage portions of your intermodal moves, reference the SmartWay carrier performance ranges published by Natural Resources Canada to ensure your trucking partners meet baseline efficiency standards. By establishing these requirements during the Request for Proposal (RFP) stage, you ensure that emissions data collection is treated as a core operational metric rather than an afterthought. This proactive data collection allows sustainability teams to generate quarterly progress reports that demonstrate clear, measurable progress toward corporate net-zero targets.
Canadian Freight Emissions Reality Check
- Over-the-road trucking currently accounts for over 70% of Canada’s domestic freight emissions.
- Shifting just 10% of long-haul highway lanes to intermodal rail would reduce greenhouse gas emissions by over 17 million tonnes annually.
- Class 1 Freight Railways in Canada have improved their greenhouse gas emissions intensity by 28.8% since 2005.
- A single intermodal train removes upwards of 300 long-haul trucks from the highway network.
By centralizing your intermodal strategy through a single point of entry like RailGateway, you eliminate the overhead of chasing data across multiple vendors. RailGateway arranges the freight and provides the consolidated routing data required to feed your internal reporting systems, streamlining your path to compliance.
To maximize the value of this consolidated data, forward-thinking organizations are integrating their emissions tracking directly into enterprise resource planning (ERP) systems like SAP, Oracle, or specialized carbon accounting platforms. By automating the data pipeline from the bill of lading to the sustainability dashboard, companies can eliminate manual data entry errors and generate real-time insights into their logistics carbon footprint. This integration allows supply chain managers to view emissions data alongside traditional metrics like transit time and cost, enabling more balanced, sustainable procurement decisions.
In cases where primary carrier data is temporarily unavailable, establishing a robust data-substitution hierarchy, such as using historical lane averages or verified secondary datasets, ensures that reporting remains continuous and compliant with the GHG Protocol’s data quality guidelines.
6. Preparing for a Scope 3 Freight Emissions Audit
Passing a scope 3 freight emissions audit demands traceable bill-of-lading data, verified carrier emission factors, and a documented methodology for every intermodal and highway lane. As ESG reporting transitions from voluntary to mandatory for many large enterprises, third-party auditors are scrutinizing supply chain data with unprecedented rigor. An audit will quickly expose any reliance on rough estimates or undocumented assumptions.
To prepare, maintain a centralized digital archive of every intermodal shipment. This archive must include the original bill of lading, the exact payload weight, the origin and destination rail ramps, the drayage distances, and the specific emission factors applied to the calculation. Document your methodology clearly, citing the GHG Protocol Corporate Value Chain Standard and the Railway Association of Canada as your primary data sources.
During this rigorous tracking process, protecting the financial value of your cargo remains paramount. While RailGateway arranges the physical movement of your freight, securing comprehensive coverage is a separate critical step. For shippers looking to protect high-value freight during these audited moves, our sister company ShipSimple provides all-risk shipping insurance for parcel and freight in Canada. Combining robust cargo protection with rigorous emissions tracking ensures your supply chain is both financially secure and environmentally compliant.
When preparing for a formal third-party ESG audit, understanding the auditor’s perspective is key to a smooth process. Major accounting firms and specialized environmental auditors will perform substantive testing on your logistics data, which involves selecting a random sample of shipments and tracing them from the final emissions report back to the original source documents. They will verify that the payload weights match the certified scale tickets, that the rail distances align with official CN or CPKC route maps, and that the emission factors used are the exact, unaltered figures published by the Railway Association of Canada for that specific reporting year.
To pass this level of scrutiny, companies must establish strong internal controls, such as monthly data reconciliation processes and clear segregation of duties between the logistics team entering the shipment data and the sustainability team compiling the carbon reports. Having a documented, repeatable methodology document that explains every step of your calculation process is often the first thing an auditor will request, and a well-prepared methodology is the best defense against audit findings or data qualifications.
7. Maximizing Payload to Optimize Your Intermodal Freight Carbon Footprint
Maximizing container payload directly improves your intermodal freight carbon footprint by reducing the total number of shipments required to move your annual volume. The math is straightforward. If you ship 10,000 tonnes of product annually, maximizing the weight inside each 40-foot or 53-foot container means you book fewer total containers. Fewer containers mean fewer drayage trips and a lower total tkm allocation on the rail network, driving significant rail freight emissions reduction.
However, optimizing payload requires strict adherence to CN and CPKC equipment specifications. Overloading a container leads to delays, fines, and safety hazards, while underloading leaves valuable capacity and emissions savings on the table.
CN sets payload limits by origin and destination lane rather than a single fleet-wide ceiling, as shown below:
- Domestic Canada, most lanes (e.g. ON/QC/AB/BC to and from Maritimes/Prairies): 57,300 lbs
- Ontario/Quebec to and from Maritimes: 59,500 lbs
- Canada/Mexico into Quebec (Spring Thaw restriction): 49,600 lbs
- U.S. to and from Canada: 61,700 lbs (origin) / 41,000 lbs (destination side varies)
- Mexico to and from US/Canada: 41,000-55,000 lbs depending on direction
For shippers utilizing 40-foot equipment, the limits differ based on the container type. A standard 40-foot container supports a maximum payload of 60,000 lbs (Dry) or 58,000-59,000 lbs (Insulated) on most domestic Canadian lanes.
CN sets payload limits by origin and destination lane rather than a single fleet-wide ceiling, as shown below:
- Domestic Canada, most lanes: 60,000 lbs (Dry) / 58,000-59,000 lbs (Insulated)
- Quebec Spring Thaw restriction: 52,590 lbs (Dry) / 51,000 lbs (Insulated)
- U.S. lanes: 44,000 lbs (Dry) / 39,000-42,200 lbs (Insulated, genset-dependent)
By engineering your pallet configurations to safely hit these maximums, you actively lower your scope 3 emissions freight profile while maximizing the 30-50% cost savings inherent to intermodal rail.

8. The Strategic Shift: Implementing Rail Freight Emissions Reduction
Transitioning your supply chain to achieve rail freight emissions reduction requires partnering with an expert who understands the intricacies of the Canadian rail network. Managing direct relationships with Class 1 Railways involves significant administrative overhead, complex pricing structures, and rigid volume commitments. For most businesses, this complexity acts as a barrier to entry, keeping their freight trapped on the highway.
RailGateway strips away this complexity. As an asset-free brokerage, we arrange intermodal rail freight using CN and CPKC equipment, providing a single point of entry for businesses to move 40-foot and 53-foot containers. Our team leverages over 35 years of Canadian logistics experience to optimize your routing, manage the drayage connections, and provide the transparent data required for your scope 3 category 4 emissions reporting.
By shifting your long-haul Full Container Load (FCL) freight to RailGateway, you immediately unlock up to 75% lower emissions and secure a 30-50% reduction in transportation costs. This is not a theoretical exercise. It is a proven, data-backed strategy to protect your margins against rising fuel costs while satisfying the strictest ESG reporting requirements. Stop bleeding margin on the highway and start building a resilient, sustainable supply chain today. Get an instant quote to see the exact financial and environmental impact rail can have on your specific lanes, or contact a logistics specialist to discuss your upstream transportation emissions reporting strategy in detail.
Frequently Asked Questions
What are scope 3 category 4 emissions in freight logistics?
Scope 3 category 4 emissions encompass all indirect greenhouse gases generated by upstream transportation and distribution services. For Canadian shippers, this includes the carbon footprint of third-party carriers moving your 40-foot and 53-foot containers. Tracking these emissions requires precise tonne-kilometre data to satisfy the GHG Protocol Corporate Value Chain Standard.
How much does intermodal rail reduce greenhouse gas emissions compared to trucking?
Intermodal rail reduces greenhouse gas emissions by up to 75% compared to over-the-road trucking on the same long-haul corridor. By shifting freight to the CN and CPKC networks, a single train can replace hundreds of heavy-duty trucks, drastically lowering your overall scope 3 emissions freight profile.
How much money can my business save by shifting to intermodal rail?
Businesses consistently save 30-50% on long-haul freight costs by shifting from over-the-road trucking to intermodal rail. This 30-50% cost reduction provides a high-capacity hedge against volatile highway fuel surcharges while simultaneously improving your corporate carbon footprint.
How do I calculate my freight carbon footprint for an intermodal shipment?
A freight carbon footprint calculation requires multiplying the total payload weight by the distance traveled and the specific emission factor for the transport mode. For intermodal moves, you must calculate the rail segment using Railway Association of Canada emission factors and add the highway drayage segment to find the total carbon dioxide equivalent.
Why are Railway Association of Canada emission factors important for ESG audits?
Railway Association of Canada emission factors provide verified, localized data specific to Canadian Class 1 Railways like CN and CPKC. During a scope 3 freight emissions audit, third-party auditors require this precise, region-specific data rather than generic global averages to validate your reported rail freight emissions reduction.
What is the maximum payload for a 53-foot container on CN rail?
A 53-foot domestic container carries up to 57,300 lbs on most domestic Canadian lanes, according to CN equipment specifications. However, CN sets payload limits by origin and destination lane, such as 59,500 lbs for Ontario to the Maritimes, or 49,600 lbs during the Quebec Spring Thaw restriction.
How do intermodal rail transit times compare to over-the-road trucking?
Intermodal rail transit times are typically 1 to 2 days longer than direct over-the-road trucking on major Canadian corridors. This slight variance is due to terminal loading, rail scheduling, and drayage transfers. However, rail schedules are highly consistent and unaffected by highway congestion or driver hours-of-service limits, allowing for reliable supply chain planning.